Research
VH-MDX
On the night of 9 August 1981 a Cessna 210 carrying five men vanished over the Barrington Tops in New South Wales, and forty-five years of searching, radar geometry, sixteen thousand simulated flights and airborne lidar still cannot say exactly where it lies.
Contents
Not found.
If the Wittenoom paper is right that Williamtown's antenna was tilted up 1°, the radar's floor over the estimated fade point sat near 6,200 ft. On the tape log, Hutchins came down through that height at 19:36–19:37. That makes the last radar position the point where VH-MDX dropped below the beam, not where it crashed, and it flew on for at least three minutes. Sixteen thousand simulated flights that fit the radio log spread the likely impact widely: the most likely half covers about 1,000 km², and only about a quarter of it lies inside the box searched in 1981. The public 2018 lidar under the fade point averages 0.02 ground points per square metre. That is too sparse to see a light aircraft under 40 m eucalypts, and air photos from 1972 and 1983 show no fresh scar at any lidar candidate. The same methods also failed to pick out three wrecks whose fate is known, so a blank result says little. Finding the wreck needs a narrower corridor and a dedicated survey.
Antarctic beech canopy, Barrington Tops
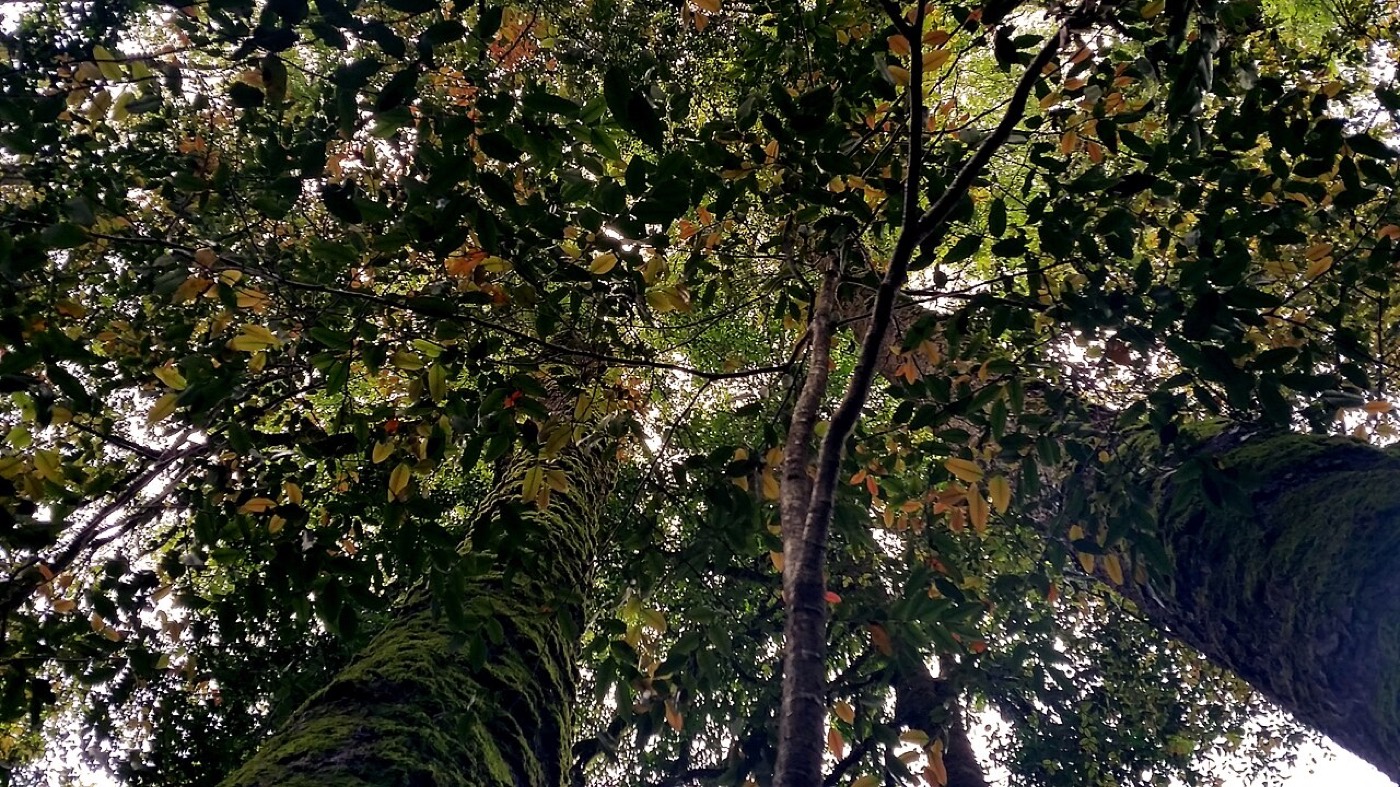
A tired pilot with a failing instrument flew into cloud, ice and a gale over the ranges at night. The radio log records nineteen minutes of it, and it is the only hard evidence of where the aircraft went.
On 9 August 1981 Mike Hutchins was flying four Sydney workmates home. The men had spent about a week on a boat in the Whitsunday Passage. Hutchins was 52 and had more than 3,000 hours. He left Proserpine a little after ten in the morning, refuelled at Coolangatta, and took off again at 17:02 for Bankstown. The aircraft was VH-MDX, a Cessna 210M, a retractable-gear single. It was approved for instrument flight but not for flight into known icing, and it had no de-icing equipment.
Aboard were Ken Price, a NSW Police inspector and former head of the Newcastle Water Police, plus Rhett Bosler (33), Noel Wildash (40) and Philip Pembroke (43). Price's age is given as 54 or 55 depending on the source.
The fuel attendant at Coolangatta, Gordon Grieg, later said the pilot looked pale and tired. Hutchins mentioned a gyro or electrical problem and was not interested in staying the night. The engine took several attempts to start. Each detail was minor. Together they describe a tired pilot in a hurry, with a known instrument fault, heading into the night.
At 18:50 he called Sydney Flight Information Service. He was cruising at 8,000 ft, estimated Singleton at 19:30, and wanted a clearance through RAAF Williamtown's airspace on the coast. What happened next is still argued about. One account says Williamtown declined night visual clearance because the weather was unsuitable. Another, drawing on the transcripts, says a clearance was available and was withheld. At 18:56 Hutchins chose to track inland via the Craven reporting point instead of waiting.
The tape log, paraphrased, in local time:
- 18:508,000 ftCalls Sydney FIS. Requests clearance through Williamtown airspace.
- 18:568,000 ftElects to route via Craven rather than wait for the coastal option.
- 19:198,000 ftReports over Craven, 36 nm from Singleton. Considerable turbulence and downdrafts.
- 19:23→10,000In cloud. Asks to climb. Reports loss of the artificial horizon and directional indicator. Asks for a radar steer to Bankstown.
- 19:25—ADF wandering. Confirms he is not in visual conditions. Uncertainty phase declared at 19:26.
- 19:28<8,500 ftRadar identifies him 36 nm north of Singleton. Struggling to climb. Asks for a vector to Maitland and turns south.
- 19:34—Ice. A 1,000 ft/min downdraft. Declines the Maitland diversion. Mentions a brief suspected cockpit fire.
- 19:357,500 ftVacuum pump failed. Climbing and descending erratically. Standby compass swinging.
- 19:36—Last radar position, over the Barrington Tops.
- 19:376,500 ftLosing height fast. FIS gives the lowest safe altitude: 6,000 ft.
- 19:395,000 ftLast transmission. Gives his height. Repeated calls go unanswered.
Gyros without vacuum

A flying instructor on a night training flight nearby was listening. He said the voice on the frequency started out casual and ended close to screaming. The 19:39 call put the Cessna at 5,000 ft, a thousand feet below the safe altitude for that country. The plateau tops out near 1,580 m, a little over 5,000 ft. Several popular retellings merge the ice report into the final call. On the tape log, the ice came five minutes earlier.
Sinking air in the lee

The last call fixes a time and a height, but not a place. Where the Cessna was when it fell silent depends on a route that was never flown as planned.
Route, radar and search areas
- Filed route
- Schematic deviation (inferred)
- Search area (approximate)
- Radar bearing arc, 45 nm from Williamtown
- Landmark / fix
Nine days in August
The 1981 search was one of the largest of its time, and it found nothing. Its failure shaped every search since.
The search started the next morning in gale-force wind and freezing temperatures. It ran nine days, to 18 August, and it was large for its time. Fixed-wing aircraft and helicopters flew over 400 hours between them. Police, forestry crews, the Water Board, bushwalkers and the SES worked the ground on foot, by four-wheel drive and on trail bikes. RAAF F-111s made infrared runs. Landsat and US Air Force imagery were checked. The aircraft's emergency locator beacon was never heard.
They found older wrecks and not this one. In September NSW Police ran a separate Operation Barrington Tops, which also found nothing. After that the work passed largely to volunteers, chiefly the Bushwalkers Wilderness Rescue Squad (now BSAR NSW). It has run search exercises on the Tops more or less every year since.
Each of those searches had to decide where to look, and each answer rests on a different reading of the same thin record.
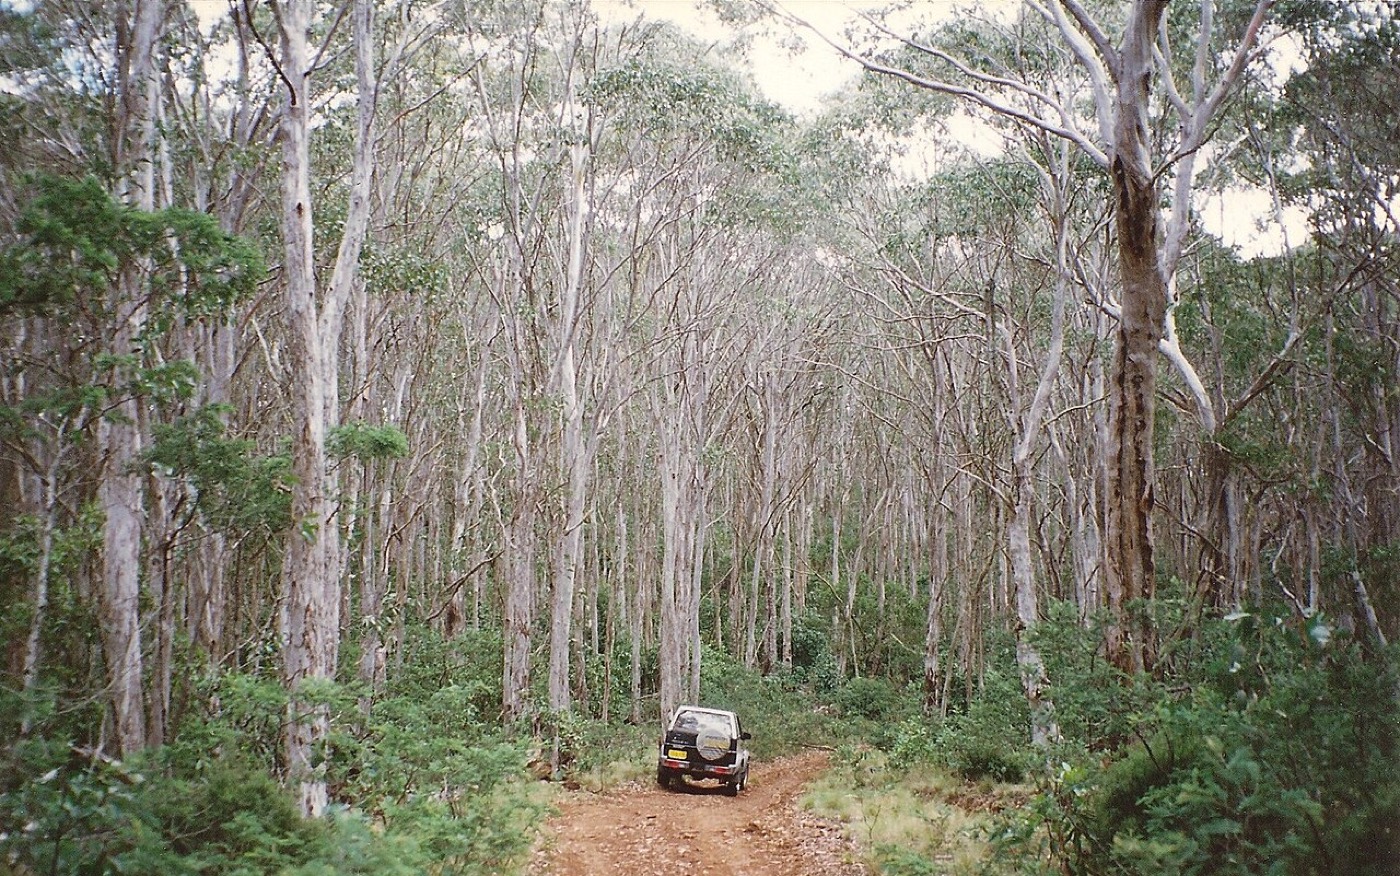
Snow gums near Mount Barrington
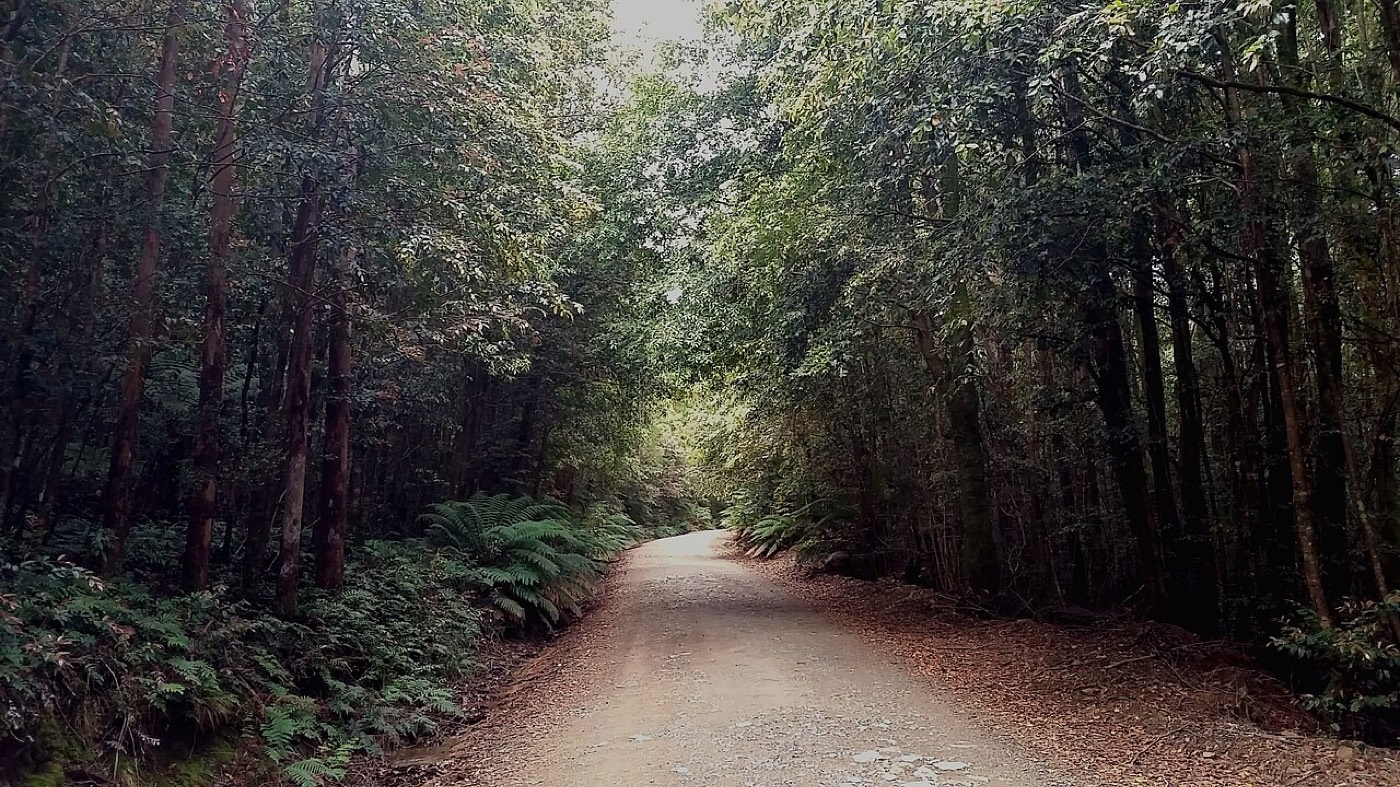
Gloucester Tops Road
Where people have looked
Nine organised searches over 45 years have covered different ground, because each trusted a different piece of evidence. None has found the aircraft.
Every serious search since 1981 rests on the same thin evidence: the tape times, a handful of radar returns, and what a few people on the ground heard. Each theory of where the aircraft lies comes down to a theory of which of those to trust.
| When | Who | Area | Result |
|---|---|---|---|
| Aug 1981 | DCA, police, RAAF, SES | Ranges around Mt Barrington | Nothing; older wrecks found |
| Sep 1981 | NSW Police | Follow-up ground search | Nothing |
| 1981– | BWRS / BSAR | Annual exercises on the Tops | Ongoing |
| Oct 2013 | Op Wittenoom, Police Rescue | Archive-narrowed box (unverified) | Nothing |
| 2013–14 | Op Phoenix | Re-timed tapes, new site | Not searched |
| 2014 | BRG / BSAR | Gloucester Tops, 10 nm east | Ongoing |
| Sep 2016 | BSAR and agencies | 9 km² core, Gloucester Tops | Nothing |
| Sep 2018 | Multi-agency exercise | More remote sensing | Nothing reported |
| Never | Gooding, Dingo Tops | Dingo Tops / Caparra, 60 km NE | Never searched |
The Operation Wittenoom paper, hosted by the Barrington Research Group, raises a problem with the Craven fix itself. If the vacuum pump was already failing near Nabiac, the directional gyro could have drifted before Hutchins reported Craven. He may have been north of where he thought he was. That moves the whole picture. It is an inference, and the paper presents it as one, but it explains why serious searchers have drifted east over the years and away from the 1981 ground.
The Newcastle Herald's 45th-anniversary piece makes the plainer point. Many aircraft lost in this region were found by accident, often by bushwalkers, often years later, and often away from any planned search line.
What Williamtown could see
Radar sees in straight lines, so mountains and the curve of the earth hide low aircraft. Over the Barrington Tops the hidden band was deep enough that the radar lost the Cessna while it was still flying.
Everything placed after 19:36 depends on one question: was the Cessna gone, or just out of sight? A ground radar sees nothing below the line from its antenna across the highest terrain in between. Over the Barrington Tops that line sits high. The ranges block the view, and the earth curves away beneath them. Add the 1° upward antenna tilt the Wittenoom paper describes, and the floor rises again.
The figure calculates that floor for every square kilometre of the ranges, then replays the descent from 19:19 to 19:39 at four different beam floors, so the moment the Cessna slips out of sight can be watched.
Radar shadow from RAAF Williamtown
- Radar waves from Williamtown, where it sees this altitude
- Edge of radar shadow: the waves stop here
- Terrain, 100 m contours
- Radar floor, in section
- Hidden at this altitude, in section
- Fix / landmark
- 1981 search area (approx.)
The tilt matters more than the terrain. With terrain alone, the lowest altitude Williamtown could see over the estimated fade point is about 3,150 ft. Only 15% of the 1981 search box would hide an aircraft at 5,000 ft. With a 1° beam floor, the radar's floor over that same point rises to about 6,200 ft. At 5,000 ft, 94% of the search box is hidden, and 41% even at 6,500 ft.
That fits the tape log uncomfortably well. At 19:35 Hutchins reported about 7,500 ft, and the last radar position came at 19:36. At 19:37 he reported 6,500 ft and losing height. A 1° floor puts the radar's loss of the Cessna right where that descent would cross it. So the 19:36 position marks where VH-MDX went below the beam. It is not where the aircraft came down. It was still flying, and talking, for at least three more minutes.
Below the beam

Three minutes in a falling aircraft is a lot of ground. The next question is how much.
Sixteen thousand ways down
A computer flew the last twenty minutes tens of thousands of times, each with different unknowns, and kept only the flights that could have produced the radio log. Where those flights came down is a map of where the aircraft could be. It does not mark where it is.
The radio log is a constraint as much as a story. Any account of the last twenty minutes has to fit what was recorded: 8,000 ft at Craven at 19:19, the instrument failures at 19:23, radar identification at 19:28, ice and a downdraft at 19:34, 7,500 ft at 19:35, 6,500 ft at 19:37 and 5,000 ft at 19:39. Then silence. The simulation is a simple flight model of a C210 with failed gyros, picking up ice in a strong west-south-west wind over this terrain. Each run draws random values for what nobody knows: where the gyro drift had really put him at Craven, his heading after 19:28, the wind, the ice rate, the radar's beam floor, and how control was lost. Only the flights that could have produced that log are kept.
Out of 197,522 attempts, 16,000 fit, about 8.1%. Each surviving flight is weighted by how well it matches the two radar fixes, at 19:28 and the fade at 19:36. The weights are deliberately soft, so a flight 30 nm from the estimated fade still counts for 40%. The figure shows where those weighted flights hit the ground, and cycles on its own through the outcomes and weightings; brushing a histogram tests any single assumption.
Keeping flights that fit

Where 16,000 simulated flights came down
All outcomes · weighted by both radar fixes · break-up debris spread downwind
- Impact density
- 50 / 80 / 95% region
- 1981 search area
- Gloucester Tops focus (2014–)
- Lidar tiles analysed
- Terrain, 100 m contours
- Radar fade 19:36 (est.)
- Outer 2 km of the model area
With both radar weights on, about 26% of the modelled impact mass lies inside the box the 1981 search covered. About 1% falls in the Gloucester Tops area that later searches moved to.
That isn't a reason to send anyone back to 1981's ground. The 1981 search was hampered by weather and canopy, not by the wrong box, so "inside the box" and "already cleared" are different things. The distribution is also wide. The single most likely 500 m cell holds about 0.05%, and the most likely half of the mass is spread over about 1,000 km². Roughly half of it lies north of 32.3° S, near the plateau; the rest falls south, in lower country towards the Hunter. The model is one interpretation of the log with stated assumptions, and it should be read that way. Its job is to rank ground by likelihood, so that a dense lidar survey or a ground team can start where it matters most.
Eight ways it could have gone
The sixteen thousand flights are not one blur. They fall into eight families, each a recognisable story of heading, drift and descent, and each ends in a different patch of country.
Grouping the accepted flights by their heading after 19:28, how fast the heading gyro drifted, where and when they dropped below the radar, how they ended and where they came down gives eight families. The two largest, together about 39% of the weighted runs, hold west-south-west or south-west and come down in or near the 1981 box. The smaller families turn further south and end in the lower valleys towards the Hunter and Williamtown, where nobody has searched. The map opens with the flights themselves piling up, then settles into the density they make and each family's most typical path.
Scenario families
A family is a statistic. To see what one of these flights might have been like from the inside, the model can be replayed second by second.
Inside one of them
The replay below follows one simulated flight from Craven to the ground, with the instruments, the view and a transcript. It shows what the workload might have been, not what happened.
Cockpit replay
The model treats the loss as weather, instruments and terrain. Not everyone has.
Rumour and the record
A missing police inspector in a corrupt decade invited darker explanations. None of them has any evidence behind it, and the people they hurt most are the families.
A plane carrying a police inspector disappears in a decade when the NSW Police force was, as the 1997 Wood Royal Commission later found, broadly corrupt. People were always going to fill that silence. The ABC's November 2026 feature, built around the Expanse podcast, collects the versions. Former news cameraman Glenn Cook says the most common one has a gang bombing the aircraft to kill Price. Then there are the smuggling versions, with gold, drugs or money and a cover-up. Another has a bookmaker aboard with $600,000. And of course aliens.
The ABC found no evidence for any of them. Kate FitzGerald, a QUT researcher who studies conspiracy belief, doesn't endorse the theories, but she explains their pull. The corruption was real, so a story that leans on it feels plausible. She also notes that the families have never had closure.
- Best supported
Weather, instruments, loss of control
Vacuum failure took out the attitude and heading gyros in cloud, ice and severe turbulence. This is the official view and fits the tape log.
- Plausible, untested
In-flight break-up
The Sydney FIS controller thought overstress could have scattered compacted wreckage across separate sites, which would make it harder to spot.
- No evidence
Bomb aimed at Inspector Price
The most common rumour, according to cameraman Glenn Cook. Nothing in the record points to it.
- No evidence
Police smuggling and a cover-up
It draws on real 1970s–80s police corruption findings. The ABC found no evidence linking Price or the flight to it.
- Unsourced
Bookmaker's $600,000
It appears in later retellings. No primary source has been found for it.
- No
Abduction by aliens
Cook mentions it. Nothing more needs saying.
Her father, she says, took his work seriously, and the corruption talk is wrong.
Merrilea Price was 23 when her father vanished. The rumours still upset her. A reader who signs himself as Phillip Pembroke's son wrote on the Fear of Landing site that his mother was pregnant at the time. The family has a memorial plaque and no grave. Those are the people a find would actually matter to. Whether a laptop and public survey data can do better than nine searches is the question that remains.
Polblue Mountain and Swamp, about 1,450 m
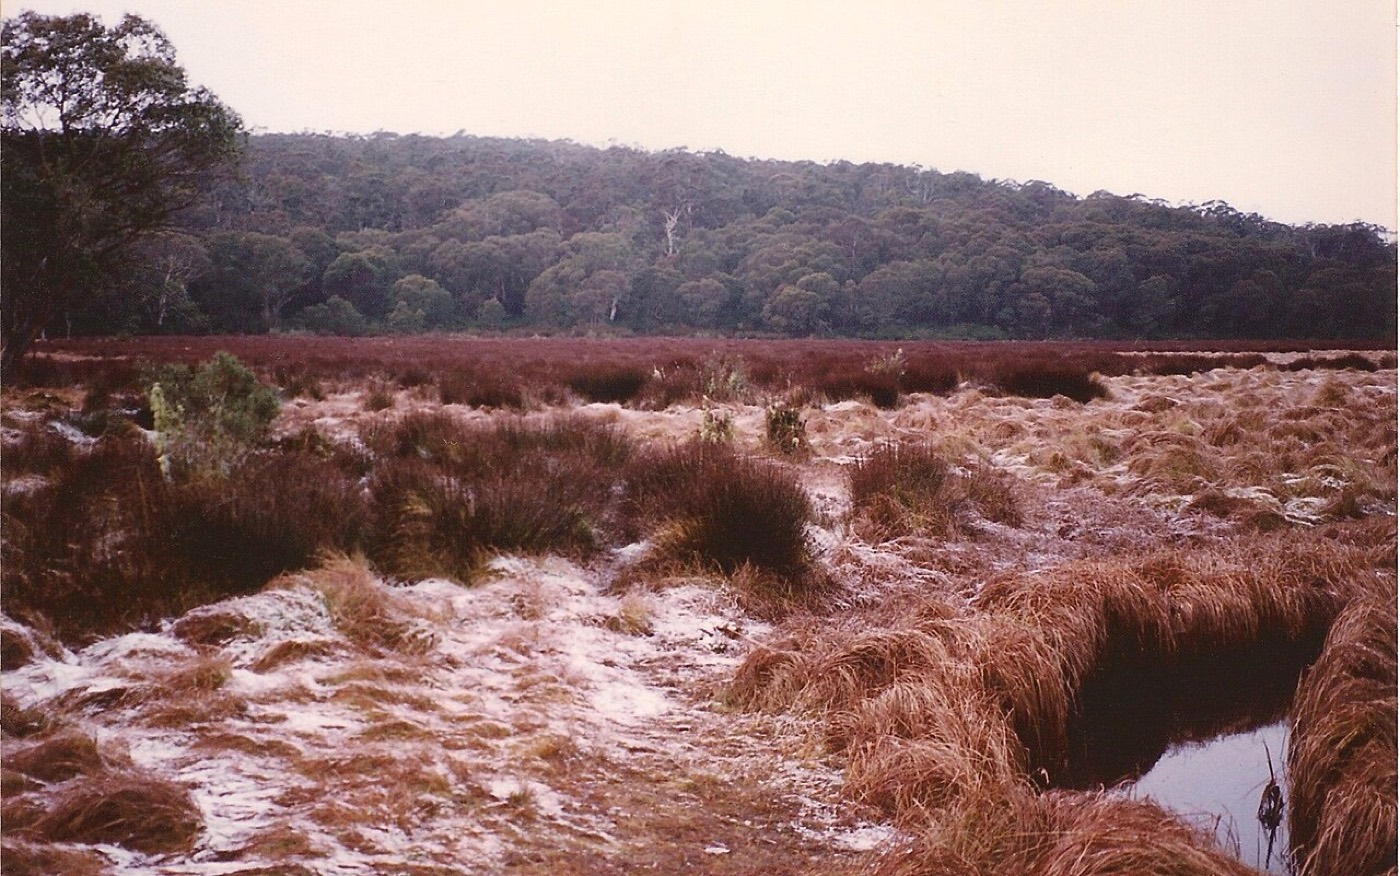
Reading the ground through the trees
Airborne laser scanning can map the forest floor under the canopy. The public survey over the Tops is not dense enough to show a small, old wreck.
Airborne lidar fires laser pulses from an aircraft and records every return. The first returns come off the top of the canopy, more come off branches on the way down, and some get through gaps to the ground. Sort the points, keep the ones that hit the ground, and the result is a bare-earth model of terrain no one can see from the air. Archaeologists have used this to find roads, terraces and whole towns under rainforest. The question for VH-MDX is narrower and harder. Would a 45-year-old light aircraft wreck show up at all?
Lidar under 40 m trees

The data exists. NSW Spatial Services publishes classified point clouds through the national ELVIS portal, free to download in 2 × 2 km tiles. Over the Barrington Tops the ELVIS inspection tool returns one survey, UPPER MANNING 201805, captured in 2018. It also returns Geoscience Australia's 5 m Manning River DEM mosaic, which is far too coarse for this.
Point density and what it can show
1 pt/m² · 22% to groundOlder NSW captures under wet forest. Only a few ground points per 10 × 10 m patch.
4 pts/m² · 22% to groundThe current NSW minimum. A wing would catch a handful of hits.
20 pts/m² · 22% to groundA dedicated low-altitude or drone capture. Debris starts to have a shape.
An intact Cessna 210 is about 8.6 m long with an 11.2 m span. After 45 years under wet sclerophyll forest it is more likely a crumpled, partly overgrown debris field a few metres across, sitting on a slope and possibly in a creek line. On a 2018 survey at around 1–4 ground points per square metre, that is a handful of points, which won't resolve an aircraft. What might show is a secondary signature: a linear gap or broken-crown scar along a descent line, an anomalous mound in the bare-earth model, or a hole in ground-return density where something solid sits under the leaves.
An open toolkit
A short chain of standard steps turns a raw laser survey into maps of bare earth, canopy height and small bumps and hollows, then ranks places worth a look.
The processing uses standard open tools to read a laser survey and grid it into maps, and every step can be rerun on any tile from the public portal. Nothing in it is secret or expensive; the limit is the data.
Pipeline, step by step
The methods aren't new. They come from forest archaeology, where maps of tiny bumps and hollows reveal old roads and walls under the trees. What is specific to this search is how the candidates get ranked. A small aircraft coming down steeply into tall timber tends to leave a short, straight gap in the canopy pointing along its heading. So a gap that lines up with plausible approach headings from the radar fade should outrank a round gap from a fallen tree. Barrington has plenty of fallen trees.
The best version of this needs two looks at the forest, one before 1981 and one after, to show where a gap appeared. No pre-1981 lidar exists, but historical air photos do, and they are put to that test further on.
First pass under the radar fade
Two survey tiles under the estimated radar fade were downloaded and processed. They show how little of the laser ever reached the ground.
The two 2 × 2 km tiles covering the estimated radar-fade point, near Mount Allyn and Burraga Swamp, come from NSW Spatial Services' Camberwell survey, flown with a Leica ALS80 between 7 and 23 May 2018. This is Category 2 data with level 3 classification. Stated accuracy is 0.3 m vertical and 0.8 m horizontal at 95% confidence. At 31 MB for 8 km², the download was small, the first sign of how sparse the survey is.
Four views of the same strip
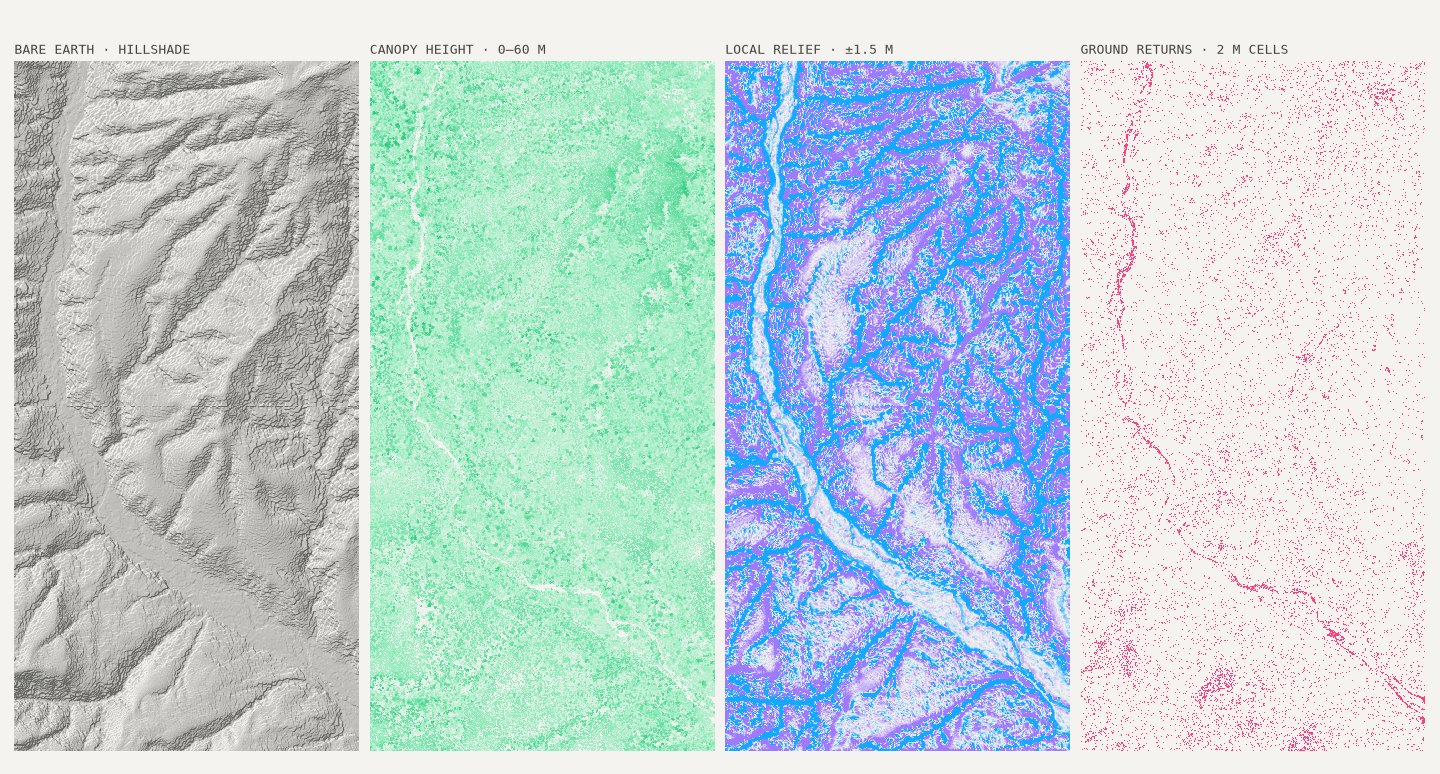
The bare-earth model looks convincing, but it shouldn't be trusted at this scale. More than nine in ten 2 m cells hold no ground return at all, so the surface between hits is triangulated guesswork. A crumpled fuselage on a slope would fall between points far more often than it would land on one.
Point slicer
The anomaly ranking did what a first pass should. It found the obvious things. The top-scoring candidates in both tiles follow the river corridor and the larger gullies, which are long, open and low, exactly what a canopy-gap detector is built to notice. None of them is a credible wreck signature. A second pass needed to remove streams and their banks before ranking, and to look for features the size of a light aircraft, not a landslip.
So, on this data: public 2018 lidar can map the terrain the Cessna would have crossed, and it can flag disturbances of tens of metres, such as a fresh scar or a run of snapped crowns. It can't see a 45-year-old Cessna 210 under 40 m eucalypts. That calls for a dedicated capture, low and slow, at twenty points per m² or more, flown over a corridor that a scenario model has already narrowed down.
Second pass with a planted aircraft
Before looking for the Cessna in the survey, a model of one was planted in it to see whether anything would come back. Almost nothing did.
An AI-assisted review of the measured data ranked fifteen analysis methods by how much each could add, and every data claim in it was checked by hand. Its first choice was the plainest. Before trying to find a Cessna in this survey, plant one in it and see whether anything comes back. That test was run, with the two cheapest fixes: a stream mask built from the terrain itself, and a filter on size and shape matched to a light aircraft rather than a landslip.
Fifteen methods, ranked by expected value
The stream mask covers 14.5% of the strip. Of the first pass's top 25 candidates, 16 now fall inside it and two more are rejected as gaps that are still open. Those were the rivers. The return count is the important number. An intact C210 outline, wings 11.2 m and fuselage 8.6 m, was dropped at 2,000 random spots under canopy taller than 20 m. Then the real 2018 laser returns that reached below its top were counted.
Plant an aircraft, count the hits

Planted aircraft and planted scars
At about 0.6 laser pulses per square metre, the 2018 survey cannot see the aircraft. Even a fresh open gap would only make the top 25 two times in a hundred.
The ranked list still has ten new candidates, all canopy patches 100–190 m² and 5–15 m tall inside 20–40 m forest. Their scores sit within 12% of each other. Each is the kind of feature a treefall leaves, and the plant test says a 1981 scar among them would rank no higher. They are places a ground team could check in passing, not leads. The survey's real use is as terrain and canopy input to the scenario model, and as a guide to where a new survey dense enough to see the aircraft would pay off.
Candidates, with and without the stream mask
Every candidate, then and now
Each place the lidar flagged was checked in air photos taken before and after 1981. None shows a fresh gap in the forest after the loss, but the photos cannot see a gap as narrow as a light aircraft would cut.
Every place named so far is collected here, with the reasoning behind each assessment. Each location opens Google Maps in satellite view at a zoom that suits it. The ten lidar candidates are canopy patches the 2018 survey flagged after the stream mask and size filter. In the 2015 20 cm orthophoto all ten sit under closed canopy, and most line up with crown shadow or treefall, not open ground. None of them is a lead. The model cells are the simulation's three most likely 500 m squares. The rest are fixes, theory sites and search areas, listed for context.
Historical air photos, aligned to a modern orthophoto, give each lidar candidate a before and after: 1964 and 1972 before the loss, June 1983 (22 months after it) and October 1992 after. No candidate shows a fresh opening in 1983 that was absent in 1972. At L3 and L8 an open patch shows in 1972 and has regrown by 1983, a disturbance from before 1981, which shows the photos can resolve one tens of metres across. L6 sits beside a long, straight pale band that appears between 1972 and 1983, a track, snig line or slip, too long and straight for a light aircraft.
Candidate dossier
Loading the candidate dossier …
Every site named in this piece
| ID | Site | Position | Basis | Verdict | What is there |
|---|---|---|---|---|---|
| Lidar candidate | |||||
| L1 | Lidar #1 (satellite view, opens in a new tab) | 32.1019°S 151.4679°E | Canopy patch 148 m² | Low | Closed forest in every photo from 1964 to 1992. What the lidar flagged is the shadow of a tall crown, in canopy averaging 29 m. |
| L2 | Lidar #2 (satellite view, opens in a new tab) | 32.1096°S 151.4667°E | Canopy patch 152 m² | Low | Closed canopy in every year. Nothing at the patch changes between the photos taken before 1981 and after. |
| L3 | Lidar #3 (satellite view, opens in a new tab) | 32.1255°S 151.4539°E | Canopy patch 140 m² | Low | An open patch just to the west shows in 1972 and has grown back by 1983. It came before the loss, and it shows the old photos can see a clearing tens of metres across. |
| L4 | Lidar #4 (satellite view, opens in a new tab) | 32.1248°S 151.4530°E | Canopy patch 140 m² | Low | A bright strip shows to the south-east in 1972. The patch itself never changes. |
| L5 | Lidar #5 (satellite view, opens in a new tab) | 32.1013°S 151.4687°E | Canopy patch 148 m² | Low | Closed canopy throughout. The 1964 photo could not be aligned reliably here, so the earliest frame to trust is 1972. |
| L6 | Lidar #6 (satellite view, opens in a new tab) | 32.0994°S 151.4552°E | Canopy patch 104 m² | Low | Beside a long, straight pale band that opens between 1972 and 1983, widens by 1992 and is still open in the 2018 lidar. Too long and straight for a light aircraft: a track, snig line or slip. |
| L7 | Lidar #7 (satellite view, opens in a new tab) | 32.1018°S 151.4675°E | Canopy patch 112 m² | Low | Closed canopy every year, under the tallest trees of the ten candidates, 31 m on average. |
| L8 | Lidar #8 (satellite view, opens in a new tab) | 32.1255°S 151.4542°E | Canopy patch 108 m² | Low | Thirty metres from L3, with the same clearing: open in 1972, grown back by 1983, so older than the loss. |
| L9 | Lidar #9 (satellite view, opens in a new tab) | 32.0962°S 151.4710°E | Canopy patch 184 m² | Low | In hillside shadow in every photo. Nothing changes across the dates. |
| L10 | Lidar #10 (satellite view, opens in a new tab) | 32.1221°S 151.4662°E | Canopy patch 188 m² | Low | No change at the patch. The straight lines across the 1983 frame are scratches on the film, not marks on the ground. |
| Model cell | |||||
| M1 | Model cell #1 (satellite view, opens in a new tab) | 32.2275°S 151.4475°E | 0.055% of impact mass | Model only | The most likely 500 m square in the simulation, on the south edge of the 1981 search box. A model result, not a sighting. |
| M2 | Model cell #2 (satellite view, opens in a new tab) | 32.2325°S 151.4525°E | 0.052% of impact mass | Model only | The next most likely square, about 700 m south-east of M1 on the same edge of the box. |
| M3 | Model cell #3 (satellite view, opens in a new tab) | 32.2275°S 151.4525°E | 0.050% of impact mass | Model only | The square just east of M1. The top three together hold about 0.16% of the modelled mass, which shows how widely the model spreads the impact. |
| Fix | |||||
| R1 | Radar fade 19:36 (satellite view, opens in a new tab) | 32.1152°S 151.4605°E | Estimate, 45 nm from Williamtown | Below the beam | Where Williamtown last saw the aircraft. With the antenna tilted up 1°, this is where the Cessna dropped below the beam, not where it came down; it flew on for at least three minutes. |
| R2 | Craven fix 19:19 (satellite view, opens in a new tab) | 32.1267°S 151.7667°E | Reporting point | May be off | Hutchins reported here at 8,000 ft. If the vacuum pump was already failing, the directional gyro may have drifted and put him north of where he thought he was. |
| Theory site | |||||
| S1 | Mt Allyn / Burraga (satellite view, opens in a new tab) | 32.1253°S 151.4293°E | Chichester–Mt Allyn theory | In the 1981 box | The ground under the radar fade, inside the box searched in 1981. The two 2018 lidar tiles in this piece were flown over it. |
| S2 | Gloucester Tops (satellite view, opens in a new tab) | 32.0613°S 151.6101°E | BRG focus since 2014 | ≈1% of mass | About 10 nm east, where searches moved from 2014. A 2016 search of a 9 km² core found nothing, and about 1% of the modelled impact mass falls in the area. |
| S3 | Dingo Tops (satellite view, opens in a new tab) | 31.6658°S 152.1433°E | Gooding, witness reports | Never searched | About 60 km north-east, near Caparra, from witness reports. Never searched, and the model puts no impact mass nearby. |
| Known wreck | |||||
| K1 | Mosquito A52-70 (satellite view, opens in a new tab) | 32.0352°S 151.4488°E | Lost 1945, found Jan 1946 | Not detected | A known wreck used as a test. The position is a memorial plaque, ±500 m. No clearing shows in any photo, and no highly ranked lidar candidate fell within 500 m. |
| K2 | Hudson VH-SML (satellite view, opens in a new tab) | 32.1734°S 151.6706°E | Lost 1954, found Dec 1956 | Not detected | The second test. The position is a derived point, ±5 km, so the window may miss the wreck; lidar candidates near it were no more common than chance. |
Known wrecks as a test
If these methods cannot find a wreck whose fate is known, a blank result for VH-MDX means little. Three known wrecks in the same ranges were put through the same tests, and none was picked out.
Nine aircraft are known to have come down in or near the Barringtons since 1945. Three of them have positions good enough, and forest similar enough, to serve as controls: the RAAF Mosquito A52-70, lost in 1945; the Hudson VH-SML, lost in 1954; and the RAAF Macchi A7-079, lost in 1987. Each was run through the same lidar ranking and air-photo comparison used for VH-MDX.
The lidar did not point at either wreck it covered, even with the area known to about half a kilometre. That was not for want of data. Both control blocks came from the same 2018 programme as the VH-MDX strip, and far more of their laser pulses reached the ground: 16% at the Mosquito site and 9% at the Hudson, against 3% under the radar fade. A planted airframe would catch three or more returns two times in three on the Mosquito block, against fewer than one in ten for VH-MDX. Still, no top-ranked candidate fell within 500 m of either site, and the hit rate around each was no better than chance.
Known wrecks and the VH-MDX model
The air photos fared no better. The national index holds no frame from before 1952 near any control, so the designed test, a frame before the loss against one after, could only be run for the Macchi. Across the 41% of its search zone the frames cover, the 1987 against 1992 comparison found no more new open patches than areas where nothing crashed. For the two older wrecks the earliest photos came years after the loss, and showed no clearing at the Mosquito site in any frame.
All three were found by people who were not looking for them: a stockman mustering cattle nine months after the Mosquito came down, an airline crew who saw a glint two years after the Hudson, and bushwalkers eight years after the Macchi.
Knowing the area to within half a kilometre still did not make a known wreck stand out.
Lost to found
| Site | Lost | Found | How found | Ground hits | Airframe ≥3 hits | Lidar top 25 within 500 m | Photos show a scar | Nearest track |
|---|---|---|---|---|---|---|---|---|
| A52-70 Mosquito | 1945 | 1946 | Stockman mustering cattle | 16.2% | 66% | 0 (chance 0.3) | No; first frame 1952 | 9 m |
| VH-SML Hudson | 1954 | 1956 | Airline crew saw a glint | 9.2% | 12% | 0 (chance 0.3) | No; first frame 1964 | 1.1 km |
| A7-079 Macchi | 1987 | 1995 | Bushwalkers, by chance | – | – | no lidar | No excess over background | Withheld |
| VH-MDX | 1981 | – | Not found | 3.0% | 9% | – | None at candidates | 691 m |
Ground hits: share of last returns classified as ground. Airframe ≥3 hits: share of 2,000 planted Cessna-sized outlines catching three or more returns. Nearest track: today's network, from the recorded position (VH-MDX: from the top lidar candidate). The VH-MDX link opens that candidate.
What is left to see
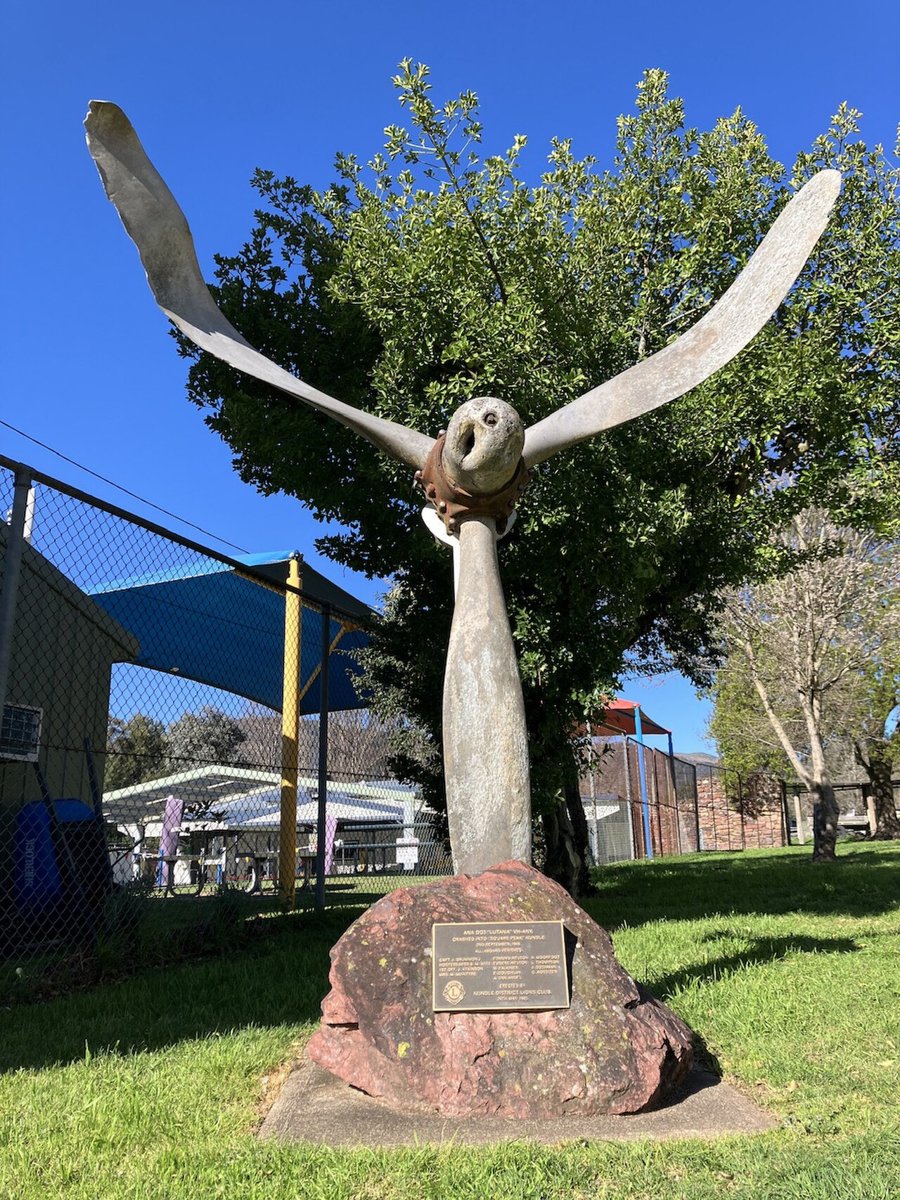
Memorial to the crash of DC-3 VH-ANK in September 1948. Dolphin51, 27 Aug 2024, CC0 1.0, via Wikimedia Commons ↗
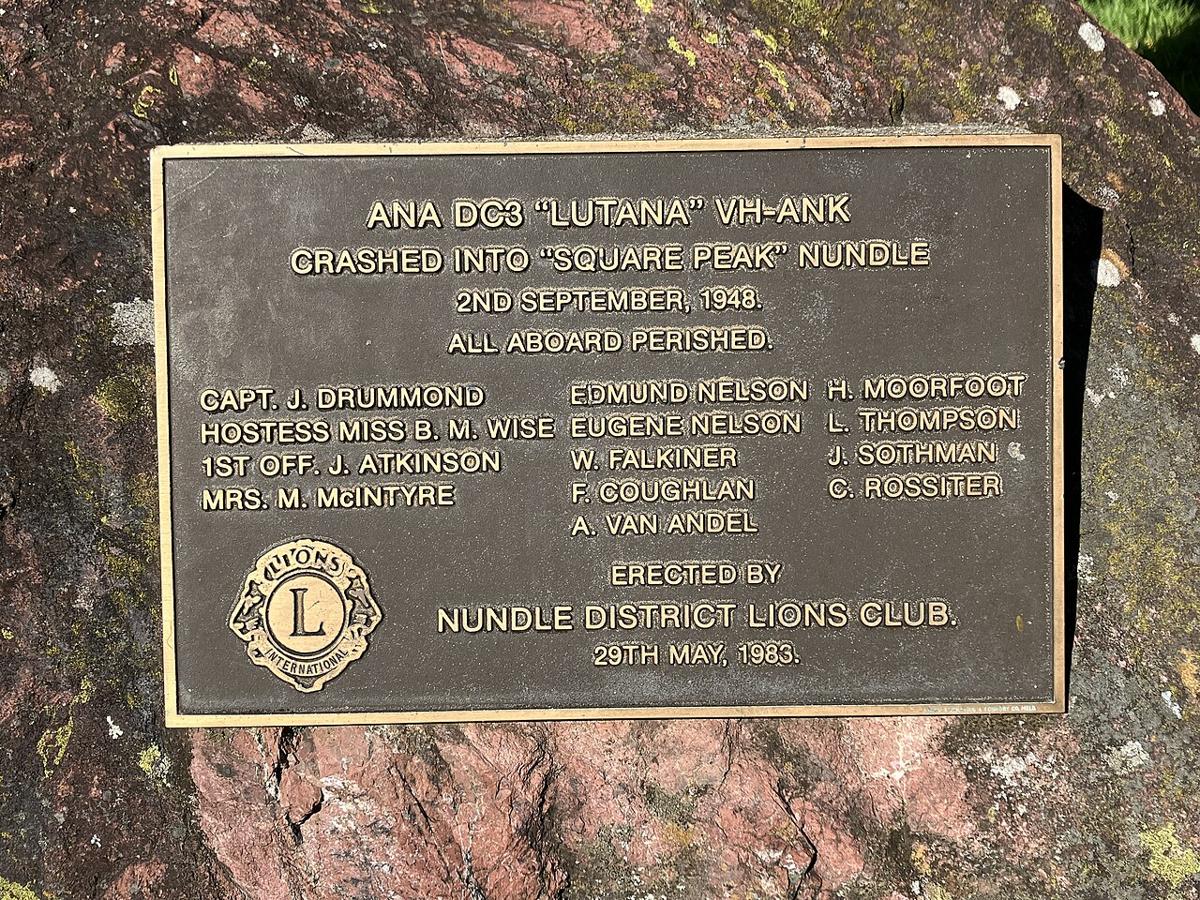
Plaque on memorial to the crash of DC-3 VH-ANK. Dolphin51, 27 Aug 2024, CC0 1.0, via Wikimedia Commons ↗
- DC-3 VH-ANK Lutana, 19481948 Australian National Airways DC-3 crash site.jpg ↗Wikimedia Commons (from baaa-acro.com). Photograph of the crash site. Licence and photographer unconfirmed.
- DC-3 VH-ANK Lutana, 1948ANA Lutana Memorial ↗nundle.com.au. Local page on the Nundle memorial.
- DC-3 VH-ANK Lutana, 1948Lutana memorial ↗Monument Australia. Entry for the Lutana memorial.
- DC-3 VH-ANK Lutana, 1948VH-ANK (2) DC-3C-S1C3G Lutana ↗Ed Coates collection. Photograph of the aircraft in service.
- DC-3 VH-ANK Lutana, 1948Photo 249072, VH-ANK ↗AirHistory.net (CAHS collection). Photograph of the aircraft in service.
- Mosquito A52-70, 1945DH98 Mosquito FB-40, serial A52-?, Laverton ↗Australian War Memorial · 1945-11 to 1946-06. A Mosquito of the same type; the serial is not confirmed as A52-70.
- Mosquito A52-70, 1945NAA A705, 166/5/1079 (accident file) ↗National Archives of Australia · 1945. Accident file for the loss.
- Mosquito A52-70, 1945A52-70 Aeroplane Hill, Barrington Tops ↗Waymarking. Waymark page for the memorial plaque on Aeroplane Hill.
- Hudson VH-SML, 1954VH-SML Lockheed, Camden c.1949 ↗Ed Coates collection (CAHS via J. Laming) · c.1949. Photograph of the Hudson in service before its loss.
- Hudson VH-SML, 1954Crash of a Lockheed Hudson (nsw112) ↗ozatwar. Crash entry for the Hudson.
- Mirage A3-52, 1967Mirage III A3-52 album ↗ADF-Serials / ADF-Gallery. Fleet page with photographs of the Mirage III.
- Mirage A3-79, 1973Mirage III A3-79 album (RAAF photo) ↗ADF-Serials / ADF-Gallery. Fleet page with photographs of the Mirage III.
- Cherokee VH-TPT, 1975VH-TPT Piper PA-28-140 Cherokee ↗Ed Coates collection. Photograph of the aircraft in service.
- Musketeer VH-MJA, 1976VH-MJA Beech A23A Musketeer ↗AirHistory.net. Photograph of the aircraft in service.
- Musketeer VH-MJA, 1976ATSB AAIR 197601498 ↗ATSB · 1976. Official accident report.
- Warrior VH-UDX, 1982VH-UDX Piper PA-28-161 Warrior II ↗AirHistory.net. Photograph of the aircraft in service.
- Warrior VH-UDX, 1982ATSB report 198201430 ↗ATSB · 1982. Official accident report.
- Macchi A7-079, 1987RAAF MB-326H type history (Aermacchi aircraft pp436-440) ↗Royal Australian Air Force. Type history of the Macchi MB-326H.
A known wreck under good data stayed hidden. That sets the bar for what would find this one.
What would find it
Public data has done what it can: it narrows the ground and shows how weak a blank result is. Finding the aircraft needs a denser survey over a narrower corridor, and the records that would place the known wrecks precisely.
| Dataset | Holder | Form | Density | Use here |
|---|---|---|---|---|
| Camberwell201805 | NSW Spatial Services | LAZ C3, 2 km tiles | 0.7 pts/m², ground 0.02 | Two tiles analysed |
| Camberwell201803 | NSW Spatial Services | LAZ C3, 2 km tiles | Same programme | Model's likely area |
| UPPER MANNING 201805 | NSW Spatial Services | LAZ, 2 km tiles | Likely similar | Northern plateau |
| NSW 1–2 m DEM | NSW Spatial Services | GeoTIFF | 1–2 m | Terrain context |
| 2025–26 releases | NSW Spatial Services | LAZ | ≥4 pts/m² spec | Coverage to check |
| State forests 2022–23 | NSW NRC | LAZ + 1 m DEM | Unknown | Forest fringes, unconfirmed |
| Australia 5 m DEM | Geoscience Australia | GeoTIFF | 5 m | Regional modelling |
| LPI sweep, Oct 2013 | NSW LPI | Unknown | Unknown | Never published |
Lidar alone is unlikely to find this aeroplane. What it can do cheaply is shrink the map. It can rank a few dozen square kilometres of forest down to a list of coordinates, each with a reason attached, that a ground team with a GPS can check in a weekend. The 1981 search had none of that, only hundreds of flying hours and a cloud base on the ridges.
| Ref | Source |
|---|---|
| ABC | ABC News, "Barrington Tops plane crash mystery fuels conspiracy theories", 17 Nov 2026 |
| FOL | Fear of Landing, "Barrington Tops Cessna", 11 Oct 2013. Radio log, weather and search totals |
| ZUPP | Owen Zupp, "Mike Delta Xray", Australian Aviation, Jun 2016 |
| WIKI | Wikipedia, "1981 Barrington Tops Cessna 210 disappearance" |
| BRG | Barrington Research Group, VH-MDX site and the "Operation Wittenoom" paper |
| NH | Newcastle Herald, "Cessna VH-MDX: 45 years after Australia's only missing civilian plane", Aug 2026 (snippet) |
| MRT | Manning River Times, "No plans to search for plane at the Tops" (snippet) |
| SCONE | Scone.com.au, "New search for missing plane begins", 16 Sep 2016 |
| BSAR | BSAR NSW, Barrington SAREX |
| ATSB | ATSB investigation 198101477 (not retrieved) |
| ELVIS | ELVIS, Elevation and Depth: Foundation Spatial Data |
| NSWSS | NSW Spatial Services, Elevation and depth products |
| ALS | Kokalj & Hesse (2017), Airborne laser scanning raster data visualization. Zakšek et al. (2011), sky-view factor. Doneus (2013), openness. |
| WRECKS | Known wrecks: ABC News (13 Nov 2026) list of crashes in the Barringtons; ADF-Serials (A3, A7 series); Pacific Wrecks and ozatwar (A52-70, VH-SML); ATSB reports 197501331, 197601498 and 198201430. Positions are from published descriptions, not survey fixes. |
| HIST | NSW Spatial Services historical aerial photography (1952–1993 frames) and NSW Imagery orthophotos (2012–2015), used for the candidate and control comparisons. |
| PHOTO | Photographs: Wikimedia Commons, authors and licences as credited. The Lutana memorial photographs are by Dolphin51, CC0. No freely licensed photograph of VH-MDX itself is known. |
Press photographs
Photographs of the five men, the aircraft and the 1981 search are held by news outlets and the families. They are copyright, and Australian fair dealing for news or review is narrower than US fair use, so they are cited and linked here rather than reproduced.